Open source uptime monitoring
Uptime Cairn tells you
when your websites and
servers go down.
Free, open source, and self-hosted. One Docker container, one file of data, no database server to set up. Running in about a minute.
Apache 2.0 · v1.1.0 · Go 1.25 · SQLite · one binary
Six heartbeat statuses
updownpendingmaintenanceunknownskippedInstall
One container,
and you are watching things.
Open http://localhost:3000 and create your account. That's it. Migrations run on start, so an upgrade is a pull and a restart.
The port is bound to 127.0.0.1 on purpose — Uptime Cairn speaks plain HTTP, so put Caddy, nginx or Traefik in front of it before exposing it to the internet.
docker run -d --restart=always -p 127.0.0.1:3000:3000 \
  -v uptime-cairn:/data \
  --name uptime-cairn \
ghcr.io/webloomlabs/uptime-cairn:latestDocker Compose
A commented reference file with a read-only root filesystem, no-new-privileges, and a healthcheck already wired up.
A plain binary
Five targets, checksummed, with a hardened systemd unit in the repo. No runtime, no interpreter, nothing to install alongside it.
A Raspberry Pi
linux/arm64 and linux/armv7 images, cross-compiled rather than emulated, so they are the same speed as everything else.
The product
What you actually get.
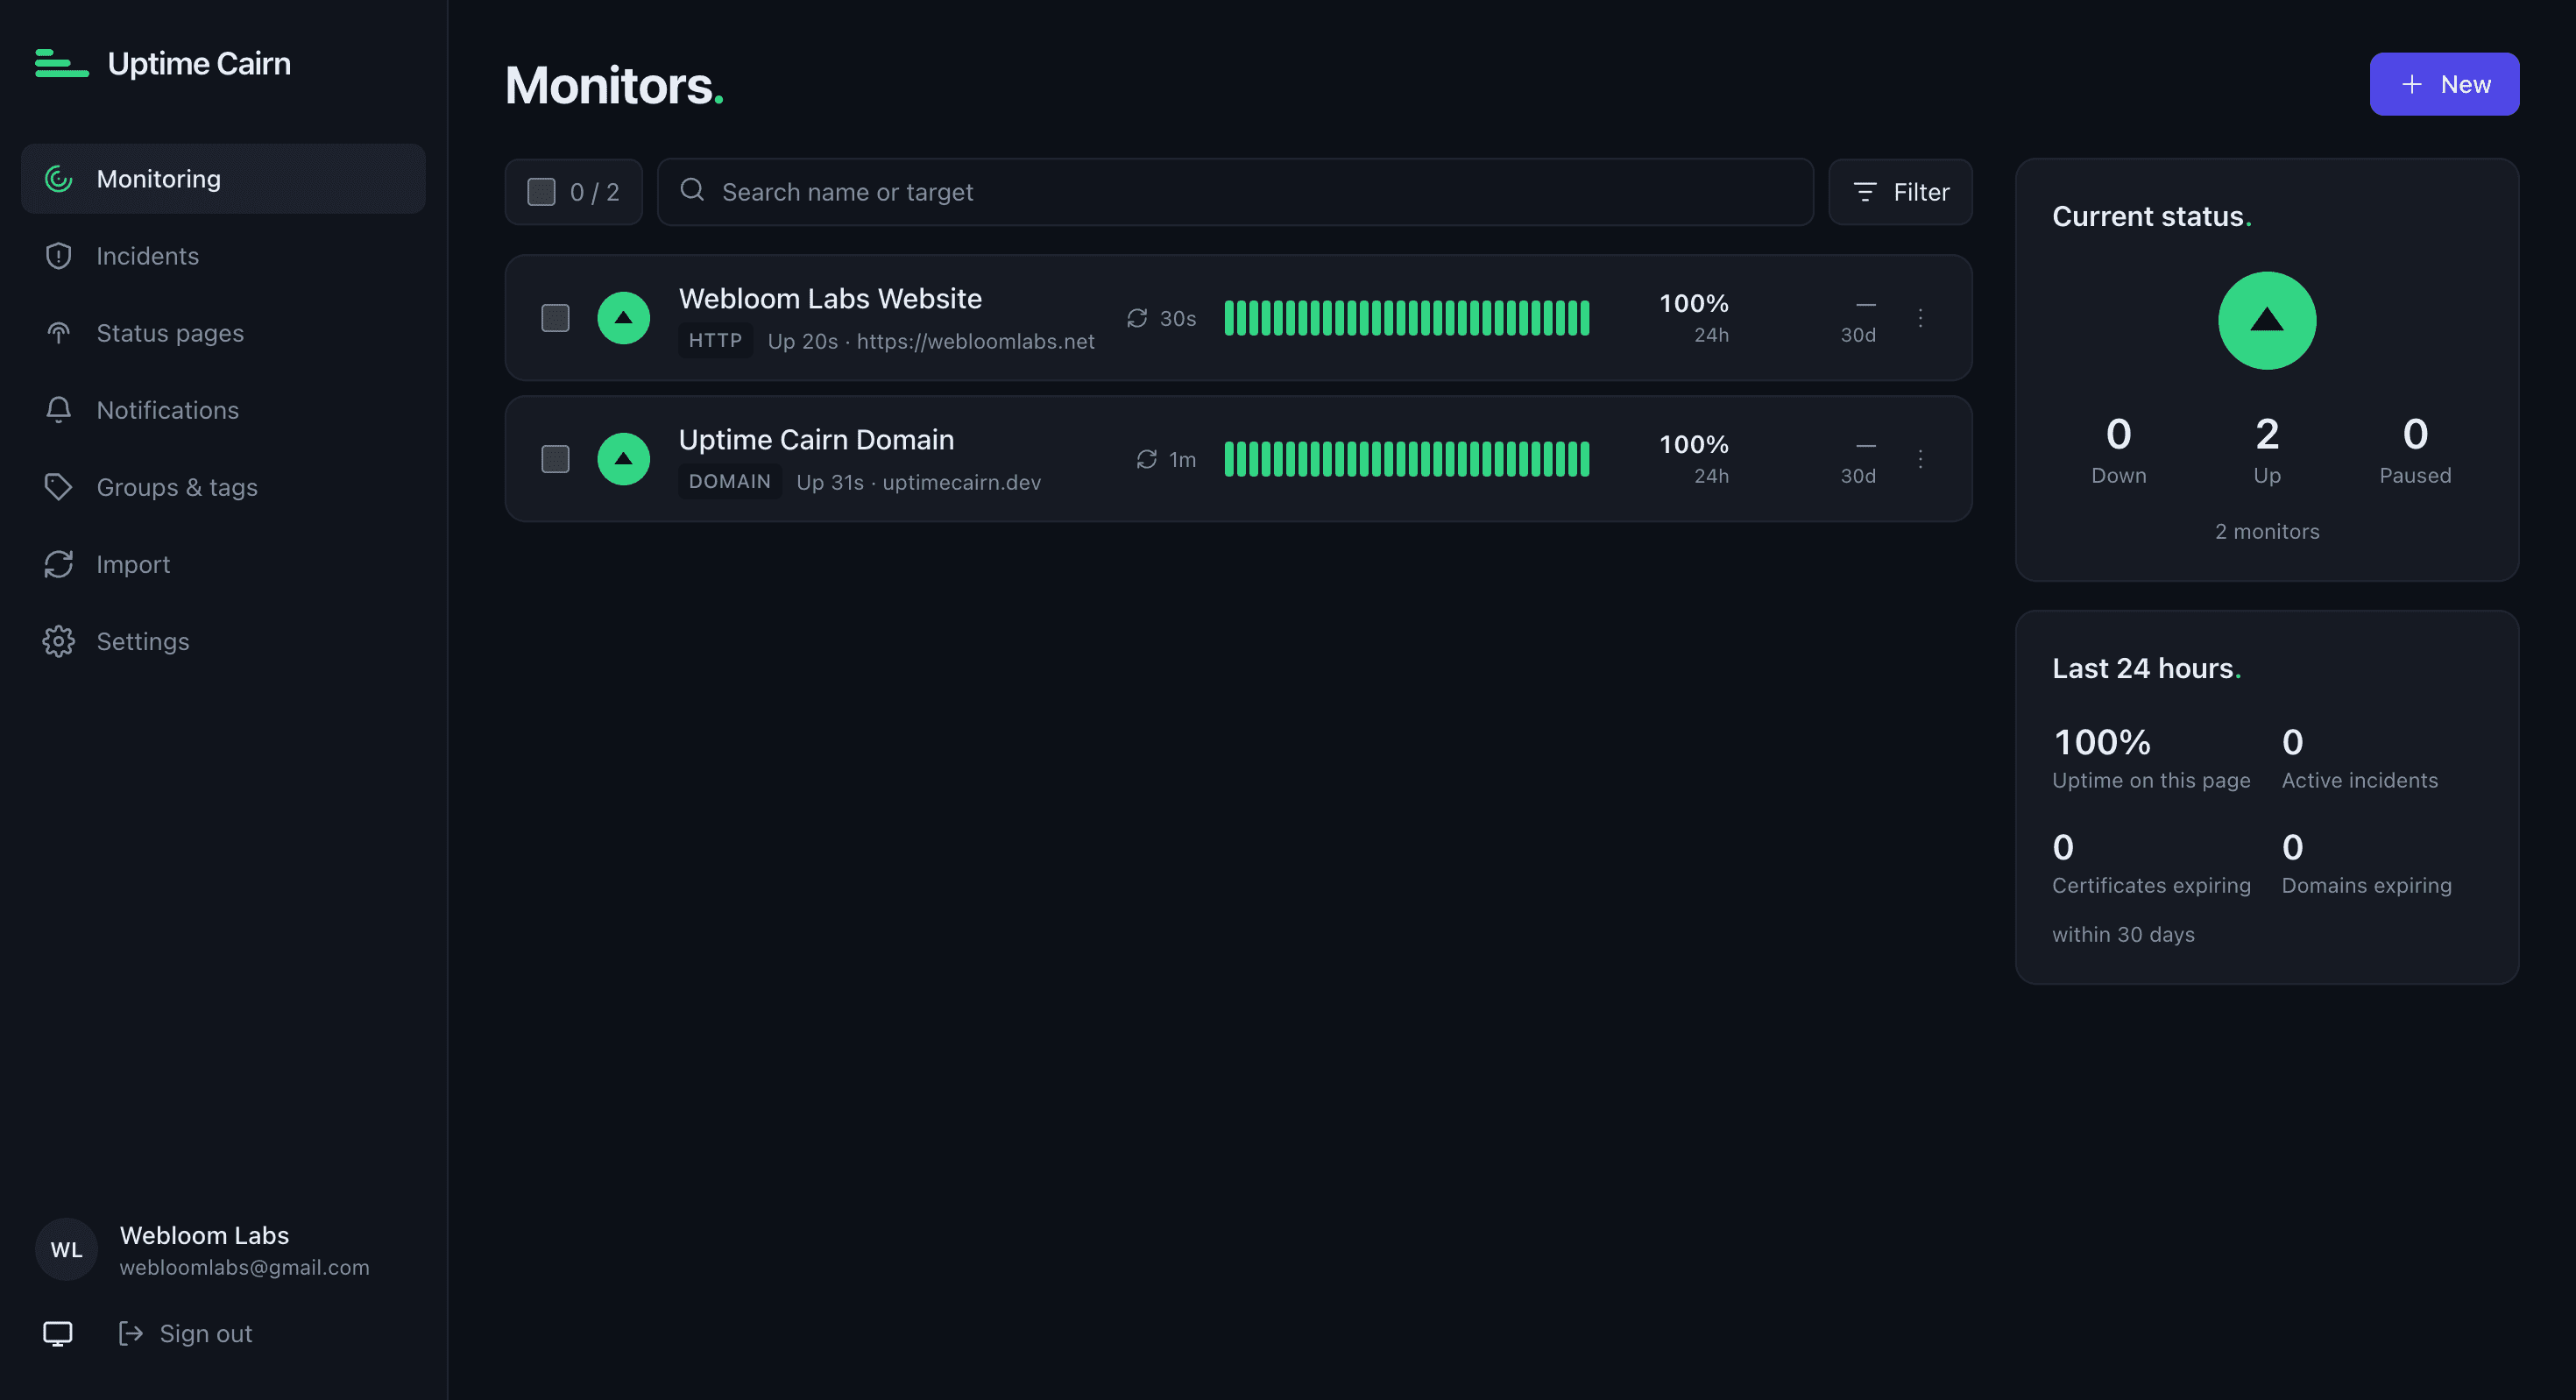
Monitors, uptime bars, and the last 24 hours at a glance.
What it does
Six things,
done properly.
Monitoring, alerting, incidents, status pages and scheduled reporting, all in the stable release. Team controls and multi-region probing are next, and none of it will be a paid add-on.
Watches things
Websites, ports, servers, DNS records, Docker containers, gRPC services, and cron jobs that are supposed to check in.
Tells you when they break
Email, Slack, Discord, Telegram, ntfy, Gotify, Matrix, Pushover, Teams, Mattermost, Google Chat, PagerDuty, Opsgenie, SMS, webhooks — plus Apprise, which adds roughly ninety more destinations.
Warns you before they break
TLS certificates and domain registrations that are about to expire, deduplicated against stored observations so a restart does not re-page you.
Shows your customers
Public status pages with uptime history and incidents, on your own domain and your own logo. The attribution link is removable.
Automates
A complete REST API written before the UI, so anything you can click you can script. The dashboard is an ordinary API client with no privileged channel.
Reports to your clients
Scheduled PDF, HTML, CSV and JSON reports on your own branding, delivered by email, Slack, webhook or an S3 drop — with SLA figures, error budgets and an expiry calendar.
Monitors
Nine things it
knows how to check.
Each type checks one thing and reports what it actually found. Where a checker cannot tell a broken target from a broken probe, it says so rather than guessing.
httpHTTP and HTTPS
The workhorse. Four assertions evaluated in order — status code, keyword, JSON path, response time — and the first failure is what the alert reports, so the message names the actual cause.
What it checkstcpA port is open
A completed TCP handshake within the timeout. Nothing is sent and nothing is read — the right check for a database or a broker whose protocol you do not want to speak.
What it checksicmpPing
Tries the unprivileged ICMP datagram socket first, then a raw socket. The type with the most environment-specific behaviour, so it has the most explicit handling.
What it checksdnsA record resolves, and to what
All ten record types, with any / all / exact matching. Walks every nameserver in resolv.conf, records NXDOMAIN and SERVFAIL verbatim, and retries truncated answers over TCP.
What it checkstls_expiryA certificate is still valid
The handshake is made unverified and the chain checked by hand, so an expired certificate is reported as expiry rather than as a generic TLS error you have to decode.
What it checksdomain_expiryThe registration has not lapsed
RDAP first, WHOIS where a registry offers none. Checked once a day per domain regardless of the interval — registries rate-limit and the data changes once a year.
What it checkspushA dead-man's switch
Backwards from every other type: nothing is checked, something calls you. For cron jobs and batch work that are supposed to check in and sometimes silently stop.
What it checksdockerA container is running
Through the Docker API over the socket. A failing HEALTHCHECK can be promoted to down, so a container that is up but broken is not reported as healthy.
What it checksgrpcA server declares itself healthy
The standard grpc.health.v1.Health/Check protocol. Ask about one service or the server overall; NOT_SERVING from a server that answered is a distinction you sometimes want.
What it checksHeartbeats
Six statuses,
and two are about the probe.
This distinction runs through the whole product. Collapsing it would mean one broken probe paging an entire on-call rotation about services that were never affected.
upThe check ran and passed.
downThe check ran and the target failed it.
pendingNothing has been checked yet. Not a verdict.
maintenanceSuppressed by a maintenance window.
unknownThe probe could not perform the check.
skippedThe probe shed the check under load.
unknown is not a soft down. A DNS lookup failing because the target's record is gone is down — a statement about the target. The same lookup failing because this host's resolver is unreachable is unknown — a statement about the probe.
Collapsing the two would mean one broken probe paging an entire on-call rotation about services that were never affected. Where a checker cannot tell the difference, it reports unknown. That is a rule rather than a preference.
Alerting
Sixteen channels,
plus about ninety more.
Test-firing a channel is a real delivery, and it reports the provider's own words back verbatim — so a misconfigured token fails on the form rather than during an outage.
Events it emits
- monitor.down
- A monitor transitions to down.
- monitor.up
- It recovers, if notify_on_recovery is on.
- monitor.pending
- It enters the pending state.
- monitor.certificate_expiring
- A TLS certificate crosses its threshold.
- monitor.domain_expiring
- The same, for a domain registration.
- incident.opened
- An incident advances — also updated and resolved.
- maintenance.started
- A window opens — also ended.
Webhook templates take {{variable}} substitution with no conditionals and no loops, on purpose. A template that can branch is a template that can fail at 3am. An unknown variable is a 422 at save time, naming it.
Not paging you forty times
Dependency suppression: give a monitor a parent and its children go quiet when the parent is down. Transitive, and the child's real outage is still recorded so uptime figures stay honest.
Maintenance windows: single, daily, weekly, monthly or cron, each evaluated in its own time zone with the database compiled into the binary. A schedule that could never fire is refused at write time.
Customers
A page you can send people to.
Status pages
Your own domain, your own logo and colours, sanitised custom CSS, and 7 to 365 days of uptime history. Email and webhook subscribers with double opt-in. The attribution link is removable — nothing in the open source build is paywalled.
Incidents
Opened from a failing check rather than posted by hand, with a timeline of updates and acknowledgement. Outbound webhooks are HMAC-signed over the exact bytes sent, with a stable event id across retries and manual redelivery.
Scale
5,000 monitors on one install, and the UI stays fast.
Every change runs against 5,000 monitors in CI before it merges. It is a gate, not a benchmark someone ran once — and it has already caught a regression in the dashboard's own listing query before v1.0 shipped. Live updates subscribe only to the monitors on screen, so push volume is bounded by the viewport rather than by how much you monitor.
5,000
monitors
load-tested in CI on every change
250
checks/sec
5,000 monitors at a 20-second interval
140
API operations
specified before the UI was written
1
binary
control plane, probe, UI and database
Fit
Whether this is
the right tool.
Uptime Kuma is excellent, and Uptime Cairn is a deliberate nod to it. But it has no write API, no user permissions, no SSO, and it slows to a crawl somewhere around 300–600 monitors — the point where people start running a second copy on another server.
A good fit if
- You self-host, and you want the data on your own infrastructure.
- You outgrew Uptime Kuma somewhere around 300–600 monitors.
- You want to script it — create, edit and report through a real write API.
- You need status pages on your own domain, with your own branding.
- You are running several Kuma instances by hand and want one install instead.
Not the right tool if
- You want APM, tracing, or log aggregation. This watches from the outside.
- You want somebody else to run it. There is no hosted tier.
- You need synthetic browser flows today — Playwright checks are a later phase.
- You need multi-region probing or SSO today. Both are on the roadmap, neither has shipped.
Coming from Uptime Kuma
Brings across monitors, tags, notifications and status pages. Point it at several Kuma databases and it merges them into one install. Use --dry-run first.
See what the importer brings acrosscairn import kuma /path/to/kuma.dbA cairn is a stack of stones built up by many passing travellers to mark the safe path for whoever comes next. Stacked stones also happen to look exactly like an uptime bar.
Documentation
Read before you install,
or after it is running.
Installing Uptime Cairn
Four ways in — Docker, Compose, a plain binary, and a Raspberry Pi — all producing one process, one database file, and a dashboard on port 3000.
Read itYour first monitor
Sixty seconds from a running install to a monitor checking something, an alert channel that really fires, and a status page your customers can read.
Read itMigrating from Uptime Kuma
What `cairn import kuma` brings across from a kuma.db, how to merge several Kuma instances into one install, and exactly what it cannot bring.
Read itReporting
Scheduled, branded reports over your monitoring history — what a template is, how a schedule fires, where the files live, and what arrives in a client's inbox.
Read itBrand profiles
White-labelling for reports: a logo, two colours, a client name, and the two lines of text that appear on the cover and in the footer.
Read itSLA methodology
The page to read when a figure is disputed: exactly what counts as downtime, what leaves the denominator, and which of those choices a report prints on its own face.
Read itMonitor types
The nine types — http, tcp, icmp, dns, tls_expiry, domain_expiry, push, docker and grpc — what each one actually checks, and the fields where the obvious reading is wrong.
Read itAlerting
Sixteen channel types, what each one needs, webhook templating, and the two rules that apply to every channel before you configure any of them.
Read itAPI conventions
Authentication, scopes, cursor pagination, error documents, and the compatibility promise — plus where to get the OpenAPI spec and the full 140-operation reference.
Read itWhy this exists
The design principles and the architecture behind them — why one binary, why SQLite, and what “no feature is paywalled” actually commits to. It lives in the product repository.
Read it on GitHubRun it yourself
Running in about
a minute.
No account, no trial, no per-monitor pricing. Pull the image and it is yours.
docker run -d --restart=always -p 127.0.0.1:3000:3000 \
  -v uptime-cairn:/data \
  --name uptime-cairn \
ghcr.io/webloomlabs/uptime-cairn:latestApache 2.0, with a contributor licence agreement that explicitly cannot be used to paywall a feature in the open build.